
Case Study 14
Understanding the Limitations of Plan Sums
Download RO-ILS Case Study 14.
Introduction
RO-ILS education typically describes specific safety events related to error(s) that reached or almost reached the patient. This event, however, focuses on some technical features of how treatment planning systems (TPSs) function and the importance of thoroughly understanding and appreciating limitations to systems that support making the best clinical decisions.
Radiation oncologists are reviewing and referencing plan sums with increasing frequency in current practice. There is an increase in re-irradiation, repeat organ irradiation and repeat irradiation,1 all of which include summation of multiple plans when records are available. Additionally, plan sums are also necessary when patients need re-simulation for any reason (e.g., changes to their anatomy or inability to adhere to the planned treatment position), and replanning is required. Therefore, a thorough knowledge of the limitations of plan sums is necessary in these clinical scenarios.
Application of this information has a potential clinical impact. If the sum of the maximum dose reported in two individual treatment plans is greater than the maximum dose reported when the plans are added using the plan sum feature, then the plans may be hotter than what is indicated by the plan sum. Often, the desired dose to a target area may be reduced to stay in safe ranges for a given organ at risk. However, if the maximum dose to an organ at risk is overestimated by the plan sum, there may be room to deliver additional dose to target areas without endangering the organ at risk. This case study aims to help the radiation oncology team, especially radiation oncologists, better appreciate the nuances of plan sums to better inform the art of data review and clinical decision making.
Event Overview
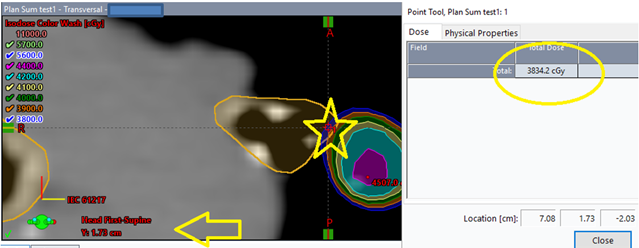
A patient with a prior history of lung stereotactic body radiation therapy (SBRT) treatment was being planned for another course of SBRT to the lung. A plan sum of the two plans was generated. In reviewing the summation of the two different data sets in the TPS, the physician noticed that the maximum point dose for the tracheobronchial tree in the plan sum displayed a lower dose (3834.3 cGy) than the dose reported to that structure by the TPS for the initial course of SBRT (4473.3 cGy), approximately a 10% difference.
Additionally, the isodose lines represented on the plan did not reflect the maximum dose on the dose volume histogram (DVH). Visually, the contour extended within the 3900 cGy cloud (Figure 1). The maximum point was listed on dose statistics as 3834.3 cGy and was located at Y=1.73, which is a point between (or "inside") the 2 mm slices of the contemporary scan. Figure 1 shows the isodose display at the location y=1.73 when viewed in one TPS.
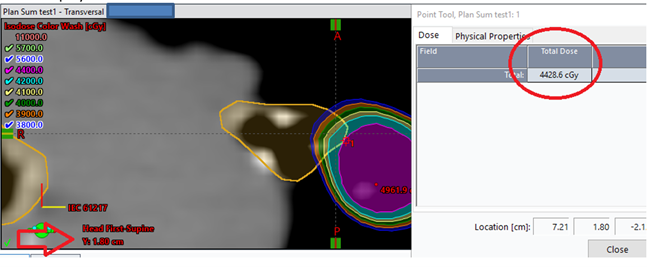
Whereas at y=1.80 the isodose display visually represents a higher dose than the dose statistics display (Figure 2).
Contributing Factors
The contemporary plan had a slice thickness of 2 mm and a calculation grid size of 2.5 mm and was fused with rigid registration to a historical plan with a slice thickness of 2.5 mm and calculation grid size of 2.5 mm. These factors contributed to the sampling coverage percentage in the plan sum for the structure TrachBronchTree to be 98.5%. Additionally, the superior slice of the structure in question was at a high gradient and in between slices. The maximum voxel was located at the edge of the slice; however, due to resolution of the dose grid and slice thickness, the maximum dose to a voxel recorded on the DVH in the TPS did not reflect that on the isodose distributions.
- For plan summations with two different datasets, even if fused with rigid registration, the observed isodose distributions are subject to uncertainties caused by the image fusion, dose grid size and contour resolution.
- In case of a deformable image fusion, the dose distribution also gets deformed. Because of the spatial uncertainty of deformable image registration especially in soft tissue, the location of the maximum dose point may be shifted to just outside a structure.
- Plans can be calculated on different dose grid sizes depending on hardware speed at the time of plan generation and clinic procedures. The dose values between the grid points are interpolated by the TPS using a TPS-specific algorithm. The differences between the interpolation algorithms create an uncertainty which is higher in locations with a steeper dose gradient.
- While contours are displayed as smooth lines, contouring algorithms employ interpolation between data points defining the contours within a slice. When rendering the contours on different views (coronal vs. axial) or on resampled slices when fusing images with different slice thicknesses, uncertainties in contour shape can be introduced. These uncertainties may lead to variation in DVH parameters, which is exacerbated for small and/or complex contours in high dose gradient areas.
When performing plan summations for two different datasets, the observed isodose distribution is only an average and only as accurate as the fusion, dose grid and contour resolution. When dose summations are provided, the TPS aligns the dose calculation matrices (based on registration) and the dose sum is represented as the interpolation between the two matrices. If two data sets are not registered exactly or the resolution of the contours, dose calculation grid, slice thickness and spacing are not an exact match, the dose sum may not be exact and can be different from the initial plan. For smaller structures, the sampling percentage is critical in reflecting DVH dose properly.
Lessons Learned/Mitigation Strategies
Pay special attention to the following points for plan summations of two different data sets, especially for small structures that are in high dose gradient areas:
- Evaluate the fusion in the region of interest, especially for soft tissue structures. AAPM Task Group Report 132 discusses methods for validating and performing quality assurance on image registration.2
- Calculate using the finest dose grid possible. AAPM recommends use of an isotropic grid size of 2 mm or finer for SBRT and SRS; for very small targets a 1 mm calculation grid size may be necessary.3,4
- Use high resolution contours for smaller structures. More data points to define a shape promotes accuracy. Auto generated contours based on a library atlas and AI-powered model-based segmentation can miss details on smaller structures and therefore the user needs to review carefully and revise as needed. The TPS manual should provide information on which contour rendering tools result in a better resolution.
- Know the geometric limitations. Consider the limitations of interpolation between slices, dose matrices, contour resolutions and image fusions. For example, while the grid resolution was consistent in this event’s plan sum, adding two different grid resolution datasets would have a smearing effect for maximum dose points. Evaluate all factors that could potentially cause uncertainty.
- Be mindful of the sampling coverage for critical structures. If the sampling coverage is less than 100%, the displayed dose may not be modeled adequately for the clinical situation.
- Consider a special physics consultation for re-irradiation cases in which there are critical structures at risk of radiation therapy induced damage, especially when there is not an exact match in dose grid, slice thickness and dose matrices. A qualified medical physicist can help explore the impact of these uncertainties and optimize the validity of the plan summation.
- Use another TPS as a secondary plan sum method to assess uncertainties in dose calculations. Be aware that TPS systems may have similar limitations.
- Consider volumetric based limitations, like D0.1cc, as these are more robust in areas of dose calculation uncertainty than a single voxel measurement. These may be affected by other factors and therefore are not a failsafe option.
Conclusion
As a part of their responsibilities, medical physicists should work to manage some of the uncertainties described above. For example, as a part of TPS commissioning and annual quality assurance, physicists determine how well the DVH is sampled from the dose grid. Calculating DVHs involves sampling the dose grid plus interpolated values in between the grid points to smooth it out.
In addition to staff oversight, technological advances can also help address this error pathway. For example, the maximum point displayed compared to the maximum point in the DVH has come closer as the computing power of software has improved and the dose grid/slice thicknesses have decreased.
Appreciating the uncertainties, even with information such as maximum dose in a plan sum that seems straightforward, is needed to inform clinical decision making and promote high quality and safe treatment.
Safety Check Question
Would this type of error be identified or caught at your practice?
References
- Andratschke N, Willmann J, Appelt AN, et al. European Society for Radiotherapy and Oncology and European Organisation for Research and Treatment of Cancer consensus on re-irradiation: definition, reporting, and clinical decision making. Lancet Oncol. 2022 Oct;23(10):e469-e478.
- Brock KK, Mutic S, McNutt TR, et al. Use of image registration and fusion algorithms and techniques in radiotherapy: Report of the AAPM Radiation Therapy Committee Task Group No. 132. Med Phys. 2017 Jul;44(7):e43-e76.
- Halvorsen PH, Cirino E, Das IJ, et al. AAPM-RSS Medical Physics Practice Guideline 9.a. for SRS-SBRT. J Appl Clin Med Phys. 2017 Sep;18(5):10-21.
- Benedict SH, Yenice KM, Followill D, et al. Stereotactic body radiation therapy: the report of AAPM Task Group 101. Med Phys. 2010 Aug;37(8):4078-101.
